Region: TWA
All
Survey Types: Species & Abundance, Species Only
Dates: 1/1/93 - 6/15/26
Total Surveys: 8
#Species Reported: 55
Average Species Reported on a Survey by Expert Surveyors: 0
Average Species Reported on a Survey by Novice Surveyors: 24.62
Survey Type: SA = Species & Abundance; SO = Species Only - How to interpret REEF data?
Click a column header to sort by that column. Hold shift and click to sort by multiple columns
| Surveys | Bottom Time | |||||
|---|---|---|---|---|---|---|
| Expert | Novice | |||||
| Code | Name | SA | SO | SA | SO | (H:M) |
| 4 | BAHAMAS, TURKS & CAICOS | 0 | 0 | 8 | 0 | 6:50 |
| 42 | CENTRAL BAHAMAS (S of New Prov. Chan & N of Crooke | 0 | 0 | 8 | 0 | 6:50 |
| 4209 | The Exuma Islands (including Great Exuma & Little | 0 | 0 | 8 | 0 | 6:50 |
| 42090045 | Shimmy Reef | 0 | 0 | 8 | 0 | 6:50 |
| TOTALS | 0 | 0 | 8 | 0 | 6:50 | |
Species
%SF = Sighting Frequency; DEN = Density Score - How to interpret REEF data?
Bar length corresponds to sighting frequency
Color saturation corresponds to density score
Click + to display species image and additional information.
Bar length corresponds to sighting frequency
Color saturation corresponds to density score
Click + to display species image and additional information.
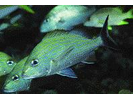
Bluestriped Grunt - Grunt
(Haemulon sciurus)
(Haemulon sciurus)
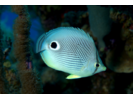
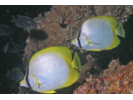
Foureye Butterflyfish - Butterflyfish
(Chaetodon capistratus)
(Chaetodon capistratus)
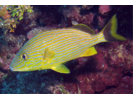
French Grunt - Grunt
(Haemulon flavolineatum)
(Haemulon flavolineatum)
Spotfin Butterflyfish - Butterflyfish
(Chaetodon ocellatus)
(Chaetodon ocellatus)
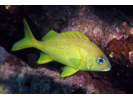
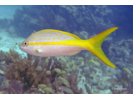
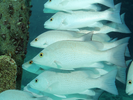
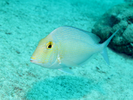
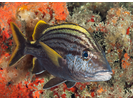
Yellowtail Snapper - Snapper
(Ocyurus chrysurus)
(Ocyurus chrysurus)
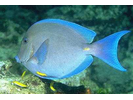
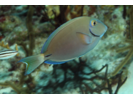
Blue Tang - Surgeonfish
(Acanthurus coeruleus)
(Acanthurus coeruleus)
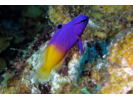
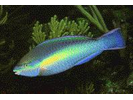
Bluehead - Wrasse
(Thalassoma bifasciatum)
(Thalassoma bifasciatum)
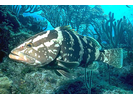
Nassau Grouper - Seabass
(Epinephelus striatus)
(Epinephelus striatus)
Ocean Surgeonfish - Surgeonfish
(Acanthurus tractus)
(Acanthurus tractus)
Stoplight Parrotfish - Parrotfish
(Sparisoma viride)
(Sparisoma viride)
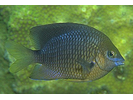
Dusky Damselfish - Damselfish
(Stegastes adustus)
(Stegastes adustus)
Fairy Basslet - Basslet
(Gramma loreto)
(Gramma loreto)
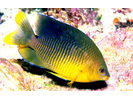
Gray Angelfish - Angelfish
(Pomacanthus arcuatus)
(Pomacanthus arcuatus)

White Grunt - Grunt
(Haemulon plumierii)
(Haemulon plumierii)
Yellowtail Damselfish - Damselfish
(Microspathodon chrysurus)
(Microspathodon chrysurus)
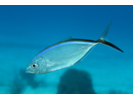
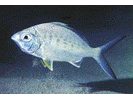
Bar Jack - Jack
(Caranx ruber)
(Caranx ruber)
Princess Parrotfish - Parrotfish
(Scarus taeniopterus)
(Scarus taeniopterus)
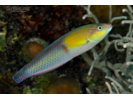
Yellowhead Wrasse - Wrasse
(Halichoeres garnoti)
(Halichoeres garnoti)
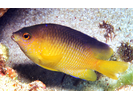
Beaugregory - Damselfish
(Stegastes leucostictus)
(Stegastes leucostictus)
Cocoa Damselfish - Damselfish
(Stegastes xanthurus)
(Stegastes xanthurus)
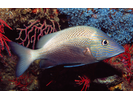
Gray Snapper - Snapper
(Lutjanus griseus)
(Lutjanus griseus)
Redband Parrotfish - Parrotfish
(Sparisoma aurofrenatum)
(Sparisoma aurofrenatum)
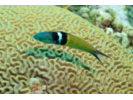
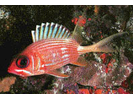
Squirrelfish - Squirrelfish
(Holocentrus adscensionis)
(Holocentrus adscensionis)

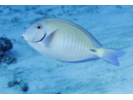
Doctorfish - Surgeonfish
(Acanthurus chirurgus)
(Acanthurus chirurgus)
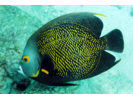
French Angelfish - Angelfish
(Pomacanthus paru)
(Pomacanthus paru)
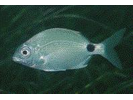
Saucereye Porgy - Porgy
(Calamus calamus)
(Calamus calamus)
Sergeant Major - Damselfish
(Abudefduf saxatilis)
(Abudefduf saxatilis)
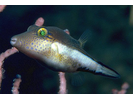
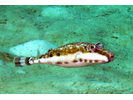
Sharpnose Puffer - Puffer
(Canthigaster rostrata)
(Canthigaster rostrata)
Threespot Damselfish - Damselfish
(Stegastes planifrons)
(Stegastes planifrons)
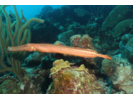
Trumpetfish - Trumpetfish
(Aulostomus maculatus)
(Aulostomus maculatus)
Lane Snapper - Snapper
(Lutjanus synagris)
(Lutjanus synagris)

Longfin Damselfish - Damselfish
(Stegastes diencaeus)
(Stegastes diencaeus)
Mutton Snapper - Snapper
(Lutjanus analis)
(Lutjanus analis)
Silver Porgy - Porgy
(Diplodus caudimacula)
(Diplodus caudimacula)
Slippery Dick - Wrasse
(Halichoeres bivittatus)
(Halichoeres bivittatus)
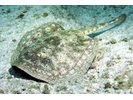
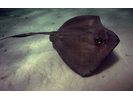
Southern Stingray - Stingray
(Hypanus americanus)
(Hypanus americanus)
Spanish Grunt - Grunt
(Haemulon macrostoma)
(Haemulon macrostoma)
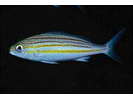
Striped Grunt - Grunt
(Haemulon striatum)
(Haemulon striatum)
Striped Parrotfish - Parrotfish
(Scarus iseri)
(Scarus iseri)
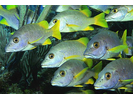
Unidentified Silvery Fish (Silversides / Anchovies / Herrings) - Silvery Fishes - Silversides, Herrings, and Anchovies
(Atheriniformes sp./ Clupeiformes sp.)
(Atheriniformes sp./ Clupeiformes sp.)

Yellowfin Mojarra - Mojarra
(Gerres cinereus)
(Gerres cinereus)
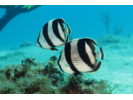
Banded Butterflyfish - Butterflyfish
(Chaetodon striatus)
(Chaetodon striatus)
Bandtail Puffer - Puffer
(Sphoeroides spengleri)
(Sphoeroides spengleri)
Blackear Wrasse - Wrasse
(Halichoeres poeyi)
(Halichoeres poeyi)
Blue Parrotfish - Parrotfish
(Scarus coeruleus)
(Scarus coeruleus)

Caesar Grunt - Grunt
(Haemulon carbonarium)
(Haemulon carbonarium)
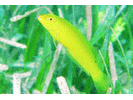
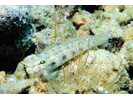
Goldspot Goby - Goby
(Gnatholepis thompsoni)
(Gnatholepis thompsoni)
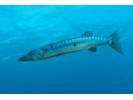
Great Barracuda - Barracuda
(Sphyraena barracuda)
(Sphyraena barracuda)
Longspine Squirrelfish - Squirrelfish
(Holocentrus rufus)
(Holocentrus rufus)
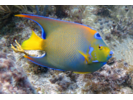
Queen Angelfish - Angelfish
(Holacanthus ciliaris)
(Holacanthus ciliaris)
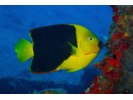
Rock Beauty - Angelfish
(Holacanthus tricolor)
(Holacanthus tricolor)
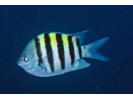
Schoolmaster - Snapper
(Lutjanus apodus)
(Lutjanus apodus)
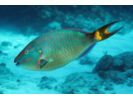
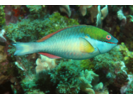
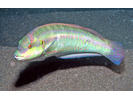
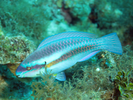
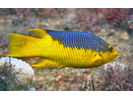
Spanish Hogfish - Wrasse
(Bodianus rufus)
(Bodianus rufus)
Yellow Goatfish - Goatfish
(Mulloidichthys martinicus)
(Mulloidichthys martinicus)

Yellow Stingray - Round Stingrays
(Urobatis jamaicensis)
(Urobatis jamaicensis)